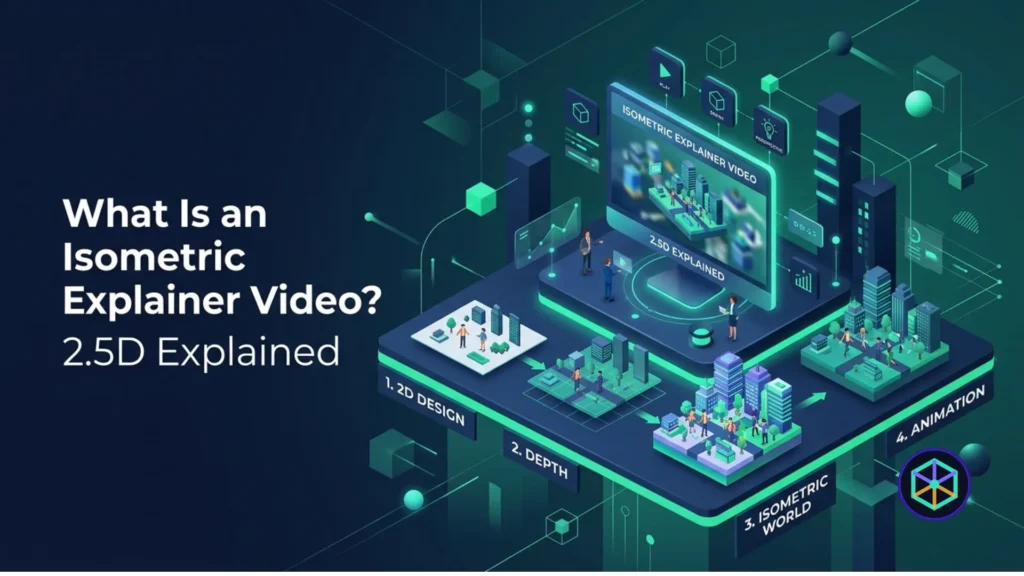
Isometric explainer videos: what they are, when they work, and what they cost
An isometric explainer video is an animated video drawn in isometric projection — a fixed, angled camera view where all three axes are held at the same scale, so objects show depth without shrinking into the distance. It is commonly called 2.5D animation, because it sits between flat 2D and full 3D. The format is used for software because a single frame can hold the interface, the logic underneath it, and the data moving between them at once. A typical 30-to-90-second production costs between $750 and $2,500 and takes two to four weeks.
That is the short version. The rest of this article covers the geometry most explanations skip, a decision rule for when the format is wrong, and what actually happens during production.
The geometry, properly explained
Almost every article on this topic says isometric means “equal measurements along each axis” and stops there. That is correct but not useful. Here is what it means in practice.
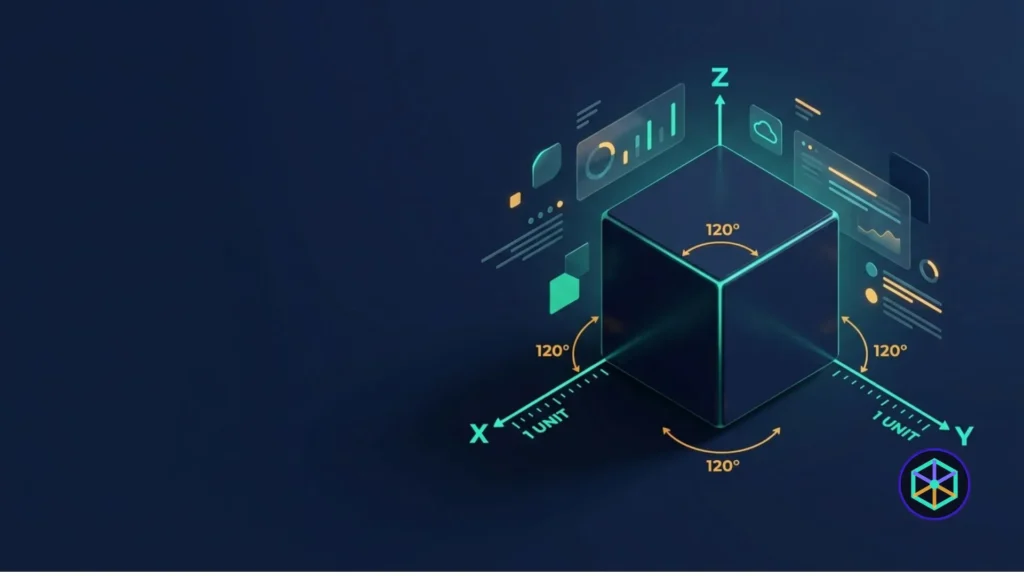
In a true isometric projection, the three spatial axes are separated by 120 degrees on the page, and the two horizontal axes sit at 30 degrees from the horizontal. Because all three are foreshortened by the same factor, a one-metre edge is drawn at the same length whether it runs left, right, or up. Nothing converges toward a vanishing point. A cube at the front of your scene is exactly the same size as an identical cube at the back.
This is the entire trick. Perspective creates hierarchy; isometric refuses to. In a perspective render, whatever sits closest to the camera dominates the frame and everything behind it visually decays. In isometric, a database at the back of a diagram is drawn at the same weight as the button at the front. For a product where the important part is often the invisible part, that is not a stylistic preference — it is the whole reason the format exists.
Isometric belongs to a wider family called axonometric projection, the same family engineering and architectural drawing has used for well over a century for exactly this reason: you can measure a drawing directly instead of correcting for distance.
The detail nobody in this industry mentions
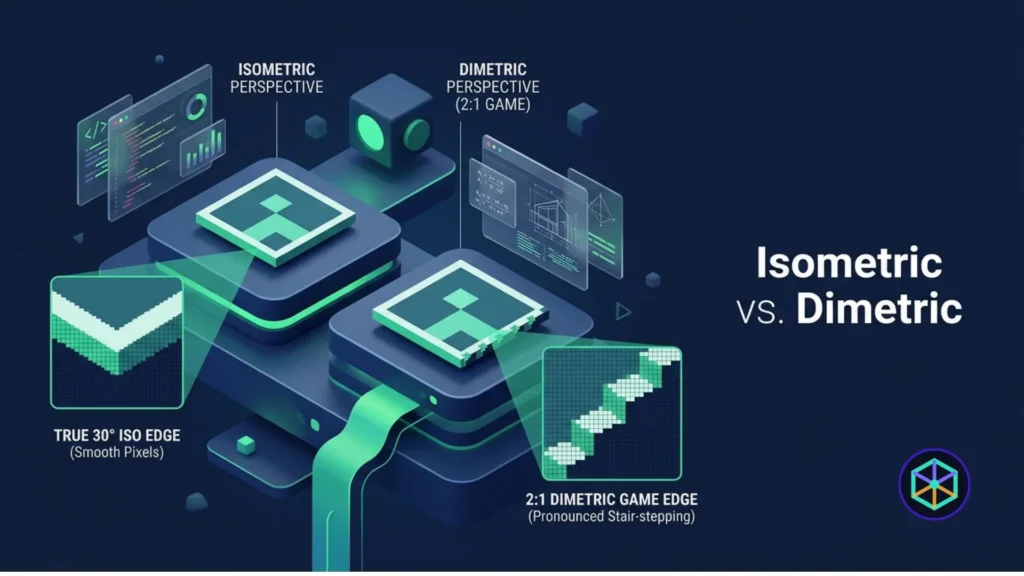
The “video game look” everyone references — the city-builders and strategy games this style is compared to — is usually not true isometric. Most of those games use dimetric projection with a 2:1 pixel ratio, roughly a 26.57 degree angle, because it renders cleanly on a pixel grid without anti-aliasing artefacts. True 30-degree isometric produces ugly stair-stepping on tile edges.
This matters commercially for one reason. When a client says “make it look like that game,” they are usually describing a feeling — ordered, legible, controllable — not a projection angle. Studios that treat the request as a geometry specification produce technically correct work that misses the brief. The projection is a means; legibility is the product.
Why the format suits software specifically
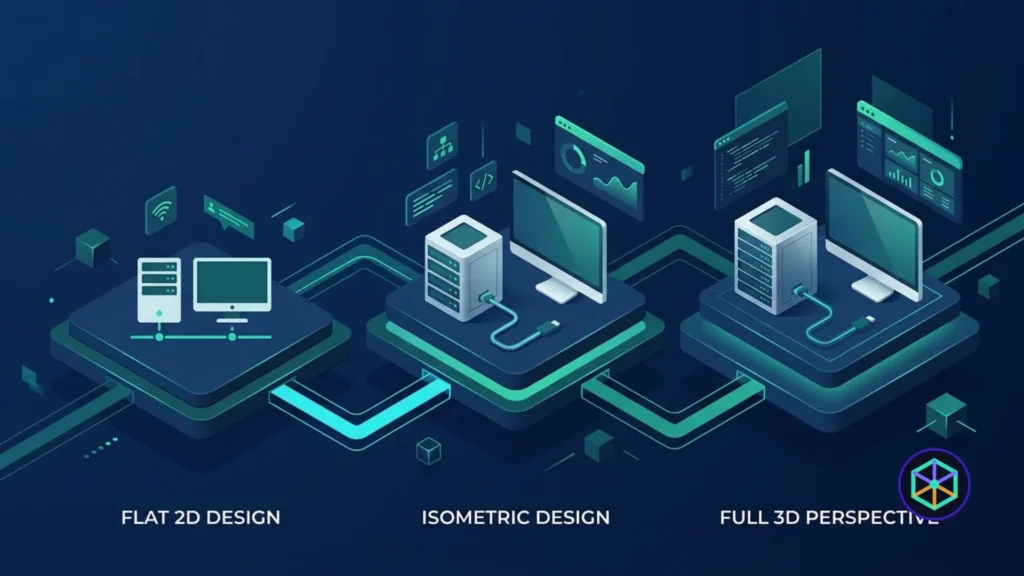
Flat 2D can show a screen. It cannot show what is behind the screen, because everything competes on one plane. Full 3D can show depth, but it introduces perspective distortion, longer render cycles, and a level of visual detail that adds nothing when the subject is a data pipeline rather than a physical object.
Isometric occupies the narrow band where three things are true at once:
- Layers stay legible. Interface on top, logic beneath, data flowing between — visible in one frame without cutting between shots.
- Nothing is falsely emphasised. Equal scaling means a security handshake at the back of the scene reads as clearly as the login button at the front.
- Production stays affordable. No lighting rigs, no camera choreography, no full 3D render farm.
This is why the format concentrates in software, infrastructure, security, logistics and industrial categories rather than in consumer brand work. The common thread is not the industry — it is that the value being sold is structural and invisible.
Isometric vs 2D vs 3D: a decision table
| Flat 2D | Isometric / 2.5D | Full 3D | |
|---|---|---|---|
| Best for | Linear stories, single-screen products, UI walkthroughs | Systems, architecture, data flows, multi-component products | Physical products, hardware, cinematic brand film |
| Shows depth | No | Yes, without distortion | Yes, with perspective |
| Camera | Static or simple pans | Fixed angle, moves within the plane | Free, fully choreographed |
| Typical production time | Fastest | Middle | Slowest |
| Relative cost | Lowest | Middle | Highest |
| Fails when | The subject has layers | The scene gets overloaded | The subject is abstract |
The decision rule, in one sentence: if you need to explain how the system works, choose isometric; if you need to show what the user does, flat 2D is usually enough. Darvideo made this distinction well in its 2026 analysis of isometric animation for SaaS, and it holds up better than most advice in this space.
When an isometric explainer video is the wrong choice
This is the section most studios leave out, because most studios sell only one format. Four situations where you should not commission one:
- Your product is genuinely simple. A single-purpose tool with one screen does not have layers to reveal. Isometric will make it look more complicated than it is, which is the opposite of the point.
- The story is about a person, not a system. Emotional, narrative-led brand films need faces and camera movement. A locked angle works against you.
- You are selling physical hardware. If the buyer needs to see materials, finish and real proportions, use 3D.
- You do not yet know what the video must accomplish. A video commissioned to “explain the product” without a specific clarity gap becomes a feature list in motion. This is the most common and most expensive mistake, and no visual style fixes it.
There is a fifth failure mode worth naming: the overloaded scene. Isometric invites you to put everything in one frame because everything fits. A scene with forty elements and no visual hierarchy is beautiful and unreadable. The format’s strength becomes its weakness the moment nobody decides what the frame is about.
What an isometric explainer video costs
Most articles on this topic answer this with “it depends” and a quote form. Here are real numbers.
At ExplainerCue Labs, pricing is fixed by runtime:
| Runtime | Price | Typical use |
|---|---|---|
| 30 seconds | $750 | Top-funnel loop, paid social, landing-page hero |
| 60 seconds | $1,500 | Mid-funnel architecture walkthrough |
| 90 seconds | $2,500 | Deep multi-system story |
Each includes script, storyboard, professional voiceover, full animation and three revision rounds. Longer or multi-video work is quoted per scope, up to $5,000 and above.
The wider market runs higher — established US studios commonly publish ranges from around $2,000 to $20,000 for comparable work, with the spread driven by studio location, scene complexity and how much original illustration is required rather than by runtime alone.
What actually moves the number: the count of distinct scenes, how much of your real interface has to be rebuilt in isometric, whether a character is animated, and voiceover talent. Runtime is a proxy for these, not the cause of them.
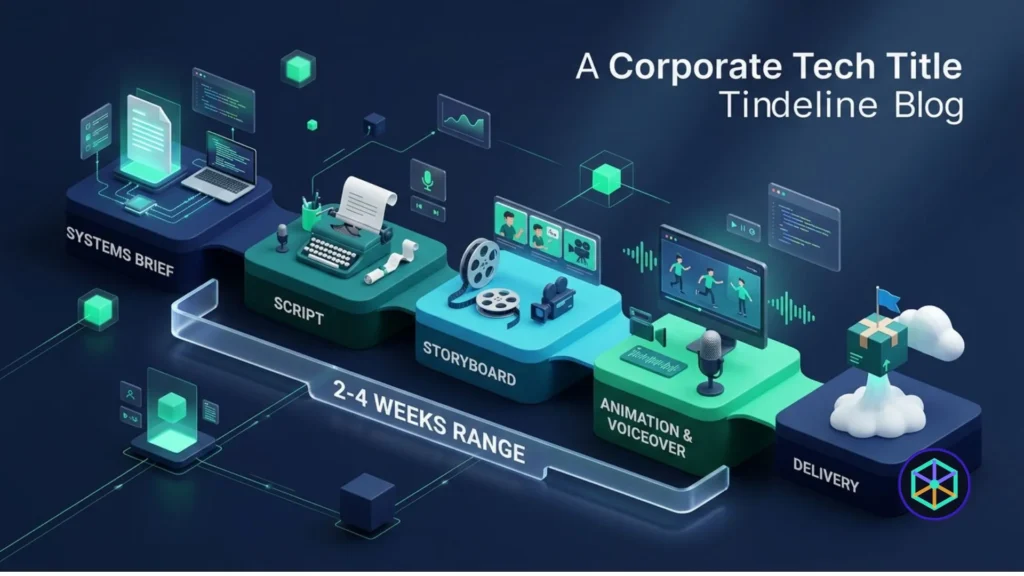
How one gets made: the five stages
- Systems brief. Map the architecture and identify the single clarity gap the video must close. Anything more than one and the video loses focus. This stage decides whether the project succeeds; everything after it is execution.
- Script. Written to the brief, timed to runtime. Roughly 140–160 spoken words per minute is the working ceiling before the visuals cannot keep pace.
- Isometric storyboard. Scene order, spatial logic and key frames. This is the cheapest place to change your mind — a revision costs minutes on a storyboard and days in animation.
- Animation and voiceover. The build itself, plus recording. Typically the longest stage but the least uncertain, because the decisions were made upstream.
- Delivery. Master file plus the cuts your funnel needs: ad ratios, captioned and silent versions, chaptered sections for sales decks.
Typical elapsed time: around two weeks for 30 seconds, three weeks for 60, and three to four weeks for 90. Storyboard approval drives the schedule far more than animation does.
A worked example: turning a support portal into a story
ATS Automation had a real problem that had nothing to do with animation. Their MyPortal platform genuinely solved machine downtime for factory customers — serial numbers, warranty status, service bulletins, at-risk parts, open service requests and spare-parts ordering in one place — but it was being sold like administrative software. Buyers saw a spreadsheet, not an operations tool.
The isometric approach did one specific thing: instead of touring features, it followed a factory operator named Anna from the moment a machine stops. Calls, texts, emails, waiting. Then the same moment inside the portal, where the machine, its history, its parts and its warranty status all sit in one connected view — with predictive monitoring layered above it.
The format mattered here because the product’s value is spatial. Anna’s machine, the parts inventory, the service network and the analytics layer are separate systems that only make sense in relation to each other. A screen recording shows one of them at a time. One isometric frame holds all four.
The full ATS MyPortal walkthrough — a ten-chapter, three-minute isometric explainer.
The video opens on Anna’s stopped machine and the current support process: calls, texts, WhatsApp and email, then waiting while a technician is scheduled or a part ships. It then moves into MyPortal, where she can see basic machine data including serial numbers, warranty status, service bulletins and at-risk obsolete parts, alongside open service requests and documented service reports. Spare-parts ordering sits in the same view. The final third moves past the portal itself into the wider service vision: instant troubleshooting through manuals and knowledge-base articles, a chatbot for questions and technician booking, IoT capability across on-premises and cloud, and scheduled preventive maintenance backed by multi-point inspections. The closing argument is that service is proactive rather than reactive — bringing actionable insight to the operator before the fault occurs.
You can see isometric explainer video examples across eleven other client projects, including logistics, fintech and cybersecurity work.
Frequently asked questions
Is an isometric explainer video the same as 2.5D animation?
In practice, yes — the terms are used interchangeably across the industry, along with “flat 3D” and “illustrative 3D.” Strictly, 2.5D describes the visual effect of depth without true perspective, while isometric describes the specific projection used to achieve it. No client has ever needed that distinction.
How long should an isometric explainer video be?
Thirty seconds for a top-funnel ad or landing-page loop, sixty seconds for a mid-funnel architecture walkthrough, and ninety seconds when a product involves several interconnected systems. Beyond ninety seconds, completion rates fall sharply unless the video is chaptered for a sales or onboarding context.
Can isometric animation match our existing brand and UI?
Yes. Real interface elements are rebuilt in isometric using your colours, typography and UI patterns, so the video reads as your product rather than a generic template. Brand matching is agreed at storyboard stage, before animation begins.
Which industries use isometric explainer videos most?
SaaS, cybersecurity, fintech, cloud and DevOps, logistics and industrial automation. The pattern is not industry-specific — these categories cluster because their value is structural and invisible, which is exactly the problem the format solves.
Deciding whether the format fits your product
Run one test before you commission anything. Describe your product out loud to someone who has never seen it, and notice where you start drawing in the air with your hands. That gesture is the clarity gap, and it is the only part of your product that needs an isometric video. Everything else can stay a screenshot.
If that gesture turns out to be a system rather than a screen — components relating to each other, data moving somewhere, a layer the user never sees — the format will earn its cost. If it doesn’t, spend the money elsewhere and we will tell you so.
We’ve shipped over 500 explainer videos and hold 250+ five-star client reviews across nine technology verticals, for teams including ATS Automation, GLS, DSV, Kikoff and Attic Security. You can see our isometric explainer video services and published pricing, or request a scoped quote with a description of the system you need people to understand.